Empire Crypto: Unlocking Powerful Ethereum Data Insights
Understanding blockchain activity is the single most valuable edge in modern trading. If you want to make smarter investment decisions, analyzing crypto data on Ethereum reveals what big institutional investors, liquidity providers, and daily users are doing in real time. Ethereum is not just a cryptocurrency—it is a decentralized global engine powering billion-dollar protocols, decentralized finance (DeFi), non-fungible tokens, and Layer 2 ecosystems. At Empire Crypto, we specialize in simplifying complex blockchain analytics so every trader can spot market trends before they hit the headlines.
What Is Crypto Data and Why Does Ethereum Matter?
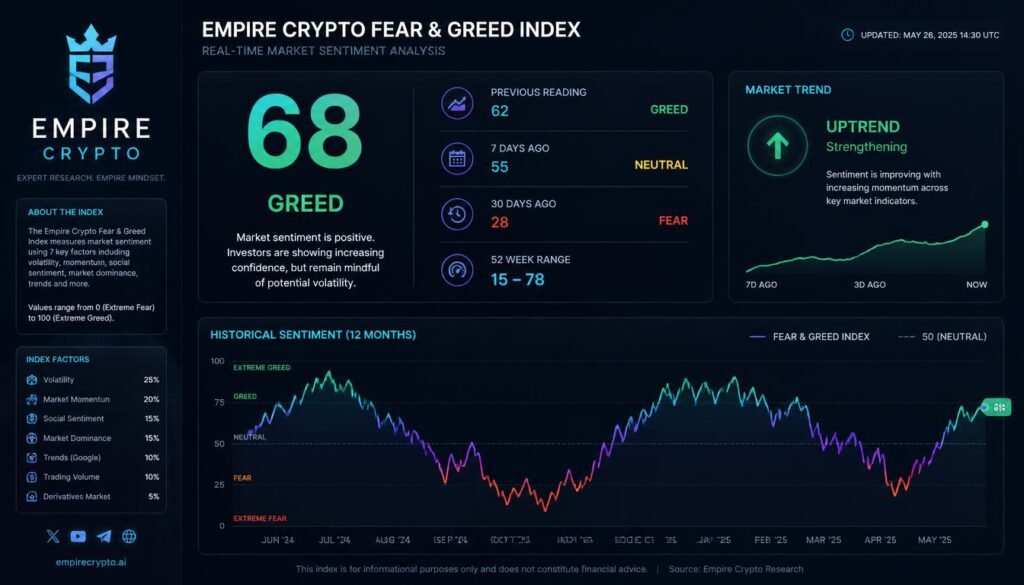
Before diving into raw metrics, it helps to establish what crypto data actually means in a Web3 context. Unlike traditional financial markets where order books and corporate balance sheets are proprietary or delayed, public blockchains operate as open ledgers. Every single transaction, smart contract interaction, token mint, and wallet transfer is permanently broadcast to the network.
When we process cryptocurrency data, we categorize it into two primary forms:
- Off-Chain Data: Information gathered from centralized exchanges, order books, derivatives funding rates, open interest, and traditional sentiment feeds.
- On-Chain Data: Raw records pulled directly from the blockchain node architecture, including active wallet addresses, gas fees, staking rates, protocol yields, and smart contract execution logs.
Ethereum remains the undisputed king of smart contract blockchains. It holds over half of the entire crypto ecosystem’s total value locked in DeFi and hosts the vast majority of stablecoin settlements worldwide. Because Ethereum is the financial layer for decentralized applications, studying Ethereum data crypto feeds gives traders early warnings regarding capital flows across the entire digital asset landscape.
Through Empire Crypto, users gain access to clear structural frameworks that turn overwhelming raw transaction logs into high-converting market intelligence.
Why Relying Only on Price Charts Fails
Traditional technical analysis (TA) uses price bars, moving averages, and momentum indicators like RSI or MACD to forecast future movements. While TA is helpful for timing entries, it only reflects past price action. It cannot tell you why a price is moving or who is accumulating behind the scenes.
Here is why technical analysis alone falls short without solid cryptocurrency data analytics:
- Exchange Whales Can Fake Volume: Large actors can create fake order book depth or wash-trade on centralized exchanges, giving a false impression of demand.
- On-Chain Truth Cannot Be Spoofed: If 50,000 ETH moves out of a major exchange wallet directly into self-custody cold storage, that physical movement is permanent and verifiable on the blockchain.
- DeFi Liquidity Shifts Instantly: Capital can exit a decentralized yield pool or DEX within minutes. Price charts lag behind these liquidity drains, but live crypto market data catches them immediately.
By combining traditional price action with fundamental data analytics cryptocurrency tools from Empire Crypto, you build a multi-layered trading setup built on real settlement data rather than speculation.
Core Ethereum Data Metrics Every Investor Must Understand
To build a strong foundation, beginners must familiarize themselves with the primary metrics that drive the Ethereum ecosystem. Analyzing these fundamental indicators helps you filter out social media noise and evaluate true network health.
1. Daily Active Addresses (DAA) and Transaction Counts
Daily Active Addresses measure the number of unique Ethereum wallet addresses participating in at least one successful transaction during a 24-hour window.
- Bullish Signal: A rising trend in active addresses accompanied by steady price growth indicates real user adoption and sustainable organic utility.
- Bearish Signal: A price rally occurring alongside declining active addresses often signals speculative manipulation that lacks real user demand.
When evaluating best crypto data, monitoring wallet growth across Ethereum mainnet and its Layer 2 networks shows whether network adoption is expanding or contracting.
2. Gas Fees and Network Utilization
Gas represents the computational work required to process transactions and execute smart contracts on the Ethereum Virtual Machine (EVM). Measured in Gwei (1 Gwei = 0.000000001 ETH), gas fees fluctuate based on network block space demand.
- High Gas Demand: Indicates heavy network usage, such as major token launches, NFT mints, high DEX trading volume, or market liquidation panics.
- Low Gas Demand: Indicates calm network conditions or user activity shifting toward Layer 2 scaling protocols like Arbitrum, Optimism, and Base.
Since the implementation of EIP-1559, a base portion of every transaction gas fee is permanently destroyed or “burned”. When transaction activity surges, more ETH is burned than issued to network validators, turning Ethereum into a deflationary asset. Tracking gas burn rate via Empire Crypto dashboards gives immediate insight into supply squeeze dynamics.
3. Total Value Locked (TVL)
Total Value Locked represents the total dollar value of assets currently deposited in decentralized finance protocols across lending platforms, automated market makers, and liquid staking contracts.
- Rising TVL: Signals that investors are depositing capital into Ethereum dApps to earn yields, borrow against collateral, or trade on DEXs. This locks up supply and builds investor confidence.
- Falling TVL: Suggests capital flight toward cash, stablecoins, or rival Layer 1 blockchains, reducing systemic liquidity.
4. Exchange Net Flows (Inflows vs. Outflows)
Tracking asset transfers between private self-custody wallets and centralized exchanges (like Binance, Coinbase, or Kraken) is one of the most effective trading data analysis cryptocurrency strategies.
- Net Exchange Inflows: Occur when traders move ETH onto exchanges. This indicates potential selling pressure, as investors prepare to liquidate or trade their holdings.
- Net Exchange Outflows: Occur when investors withdraw ETH from exchanges into cold storage wallets or staking contracts. This reduces liquid supply on exchanges and generally signals long-term bullish sentiment.
At Empire Crypto, our real-time tracking engines isolate exchange net flow anomalies so members can react before large sell-offs or supply shocks impact the spot price.
About Empire Crypto Data Solutions
As the Web3 ecosystem expands across multiple scaling layers, accessing reliable, consolidated, and actionable crypto data solution toolsets becomes essential. Empire Crypto was established to bridge the gap between institutional-grade blockchain analytics and retail crypto traders.
Raw blockchain logs contain millions of complex code calls, event emissions, and nested wallet transfers every hour. Trying to parse this raw information manually using basic block explorers is time-consuming and inefficient. Empire Crypto solves this by aggregating raw node feeds, cleaning data anomalies, and presenting key findings through clear visual dashboards.
Key pillars of the Empire Crypto platform include:
- High-Throughput Ingestion: Real-time parsing of mainnet and Layer 2 blocks for instant updates.
- Verified Metric Integrity: Ensuring high cryptocurrency data reliability so traders never base strategies on corrupted or delayed data feeds.
- Custom Alert Systems: Instant push notifications when whale address clusters move significant amounts of ETH or ERC-20 tokens.
- Comprehensive Educational Hubs: Walkthrough guides designed to help retail investors master crypto data analysis without needing software engineering backgrounds.
Through our specialized empire crypto analytics suite, users transform noisy market signals into actionable setup strategies.
Beginner Guide: How to Start Reading Ethereum On-Chain Data
If you are new to blockchain analysis, processing thousands of transactions can feel overwhelming. Following a structured step-by-step approach ensures you start with the most impact.
Step 1: Monitor Supply Distribution and Whale Wallets
Whales—entities holding thousands of ETH—exert significant influence over price direction. By using crypto data company tools from Empire Crypto, you can group wallet clusters owned by hedge funds, staking pools, protocol treasuries, and early adopters.
- Watch for wallet addresses that have been dormant for years suddenly waking up to move funds.
- Track whether whales are accumulating during market consolidations or distributing during retail rallies.
Step 2: Track Staking Dynamics Post-Merge
Since Ethereum transitioned to Proof-of-Stake, validator economics play an important role in network supply. Over 30% of all circulating ETH is currently staked to secure the network.
When analyzing cryptocurrency market data, check:
- Total Staked Ratio: Higher staking lockups reduce available market supply.
- Validator Queue Status: Long deposit queues show strong institutional appetite for native staking yield, while long withdrawal queues alert you to potential incoming selling pressure.
- Liquid Staking Derivatives (LSDs): Monitor protocol balances on platforms like Lido or Rocket Pool. Liquid staking tokens (stETH, rETH) allow users to earn yields while maintaining liquidity within DeFi applications.
Step 3: Analyze Decentralized Exchange (DEX) Volume vs. CEX Volume
Trading volume on decentralized exchanges like Uniswap, Curve, or Balancer provides an unfiltered look at organic Web3 trading demand.
When DEX volume grows faster than Centralized Exchange (CEX) volume, it shows that active crypto users are interacting directly with smart contracts rather than passive speculative trading on custodial apps. Empire Crypto tracks DEX market share in real time to show where capital is actively moving.
Advanced Ethereum Analytics for Experienced Traders
For intermediate and professional traders, surface-level metrics like transaction counts are not enough. Advanced market participants use valuation ratios, market profitability metrics, and Layer 2 settlement data to spot macro market turns.
The MVRV Ratio (Market Value to Realized Value)
The MVRV ratio compares Ethereum’s total Market Capitalization against its Realized Capitalization.
$$\text{MVRV Ratio} = \frac{\text{Market Capitalization}}{\text{Realized Capitalization}}$$
- Market Capitalization: Current circulating supply multiplied by the current spot price.
- Realized Capitalization: Calculated by valuing each coin at the exact price it last moved on the blockchain, rather than its current market value. This effectively tracks the aggregate cost basis of all market participants.
How to Interpret MVRV:
- MVRV Above 3.0: Indicates that market participants are sitting on significant unrealized gains. Historically, an MVRV ratio above 3.0 marks macro cycle tops and signals high risk of profit-taking.
- MVRV Below 1.0: Means current market cap has dropped below the collective cost basis of all holders. This indicates that the market is in deep capitulation, historically offering prime long-term accumulation opportunities.
Realized Profit and Loss (SOPR)
The Spent Output Profit Ratio (SOPR) measures the aggregate profit or loss realized by coins moved on a given day.
$$\text{SOPR} = \frac{\text{USD Value at Realized Output}}{\text{USD Value at Creation Output}}$$
- SOPR > 1.0: Holders are selling at a net profit.
- SOPR < 1.0: Holders are selling at a loss (capitulation).
- SOPR Resetting to 1.0 in a Bull Market: Acts as a major structural support line. It shows that investors are refusing to sell at a loss during pullbacks, resetting market leverage for the next leg up.
At Empire Crypto, our proprietary SOPR breakdown models isolate short-term traders from long-term holders, giving members clear visibility into market behavior.
Maximal Extractable Value (MEV) and Blob Data Analytics
In modern Ethereum network analysis, two technological frontiers heavily impact transaction speed and miner/validator revenue: MEV and Layer 2 Blob Space.
- MEV (Maximal Extractable Value): Refers to the profit validators or searchers extract by reordering, inserting, or censoring transactions within produced blocks. MEV bots monitor the public mempool for arbitrage and liquidation opportunities. High MEV activity signals high market volatility and structural inefficiencies in DeFi trading pools.
- Layer 2 Data Blobs (EIP-4844): Upgrades like Dencun introduced dedicated “blob space” to store Layer 2 transaction data cheaply without competing directly with mainnet execution gas. Analyzing blob utilization rates allows traders to measure Layer 2 scaling performance across networks like Base, Arbitrum, and Optimism.
By leveraging cutting-edge crypto data solutions from Empire Crypto, quantitative traders can monitor MEV pressure and L2 blob throughput within a single interface.
Real-World Case Studies: How On-Chain Data Saved Traders
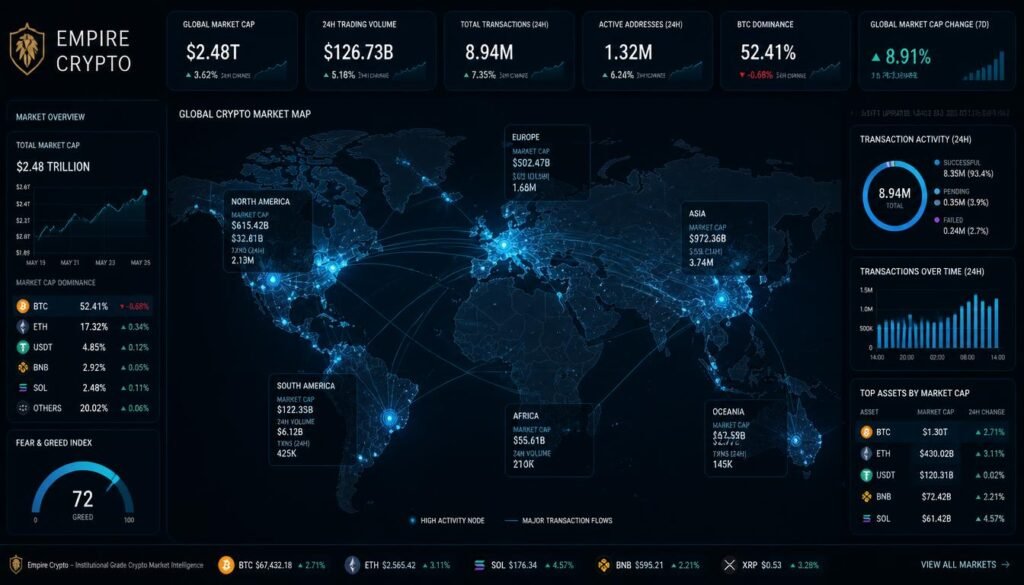
Understanding theory is valuable, but seeing how data crypto signals unfold in real market conditions proves its worth. Here are two real-world examples demonstrating the power of on-chain analysis.
Case Study 1: Spotting Whales Before a Major Market Correction
During a previous crypto expansion phase, Ethereum’s spot price was making higher highs on centralized exchanges. Technical indicators showed strong momentum, leading retail traders to enter leveraged long positions.
However, traders tracking cryptocurrency data via Empire Crypto noticed clear warning signs:
- Massive Exchange Inflows: Over 180,000 ETH flowed into exchange deposit addresses across a 48-hour period.
- Declining Active Addresses: Despite price increases, daily active wallet interactions dropped by 14%.
- SOPR Spiked to Extreme Levels: Long-term holders were aggressively taking profits into retail buy orders.
Outcome: Within three days of these on-chain divergence signals, Ethereum experienced a sharp 22% price correction. Members using Empire Crypto analytics were able to exit long positions or open protective hedges before the sell-off occurred.
Case Study 2: Identifying DeFi Accumulation During Market Fud
During a prolonged consolidation period, media sentiment was bearish, and retail interest was low. However, on-chain metrics painted a different picture:
- Record Exchange Outflows: Hundreds of thousands of ETH were moving steadily off exchange balance sheets into cold storage.
- Rising DeFi TVL: Total Value Locked in decentralized lending protocols grew steadily even while price remained range-bound.
- Smart Money Accumulation: Wallet clusters associated with successful venture funds and institutional desks were steadily buying spot ETH.
Outcome: This stealth accumulation phase laid the groundwork for a major multi-month rally. Investors relying on Empire Crypto data recognized that smart money was quietly building positions while retail traders were looking elsewhere.
Comparing On-Chain Data to Traditional Financial Metrics
To understand how revolutionary data analytics cryptocurrency systems are, compare them to standard stock market data.
| Metric Feature | Traditional Equities | Ethereum Blockchain Data |
| Data Update Frequency | Quarterly reports (10-K, 10-Q) | Real-time block production (~12 sec) |
| Data Transparency | Proprietary / Corporate audit | 100% public & verifiable on-chain |
| Custody & Location Visibility | Hidden inside institutional accounts | Visible wallet addresses & smart contracts |
| Systemic Liquidity Metrics | Estimated via broker reports | Real-time DEX liquidity pool depths |
| Insider Flow Detection | Delayed insider trading filings | Immediate alert on whale transfers |
This level of transparency gives individual investors access to the same quality of real-time operational data as major market-makers.
How Empire Crypto Elevates Your Ethereum Strategy
Navigating complex block data requires reliable processing systems that translate millions of raw nodes into clean, easy-to-read signals.
Empire Crypto delivers a comprehensive suite of analytics tools built for modern crypto traders:
1. Intuitive Analytics Dashboards
Forget staring at complex lines of JSON code or navigating cluttered block explorers. Empire Crypto organizes data into clean, visually engaging charts that highlight major market trends at a glance.
2. Multi-Layer Ethereum Tracking
As Ethereum scales across Layer 2 rollups, monitoring mainnet alone provides an incomplete picture. Empire Crypto tracks activity across Layer 1 mainnet, Arbitrum, Optimism, Base, and Polygon to ensure you get a full view of ecosystem liquidity.
3. Institutional-Grade Data Reliability
In fast-moving markets, incorrect or delayed data leads to costly trading mistakes. At Empire Crypto, our infrastructure emphasizes cryptocurrency data reliability, running redundant node backups to verify every metric before it reaches your dashboard.
4. Customizable Signal Alerts
Set custom triggers for whale movements, exchange liquidity surges, gas spikes, or sudden shifts in TVL. With Empire Crypto real-time alerts, you get direct notifications on your phone or desktop, ensuring you never miss a market opportunity.
Key Metrics to Add to Your Daily Crypto Routine
Integrating crypto market data into your daily routine doesn’t have to be time-consuming. Following a simple 5-minute morning check gives you a clear snapshot of market conditions:
- Check Exchange Net Flows: Are coins moving onto exchanges (potential selling) or off exchanges (accumulation)?
- Review Gas Price Trends: Is network usage elevated or calm?
- Monitor MVRV Ratio: Is the market approaching overbought territory or deep value zones?
- Evaluate L2 Activity Growth: Where is retail transaction volume concentrating today?
- Scan Whale Alerts: Have major wallet clusters transferred funds over the past 24 hours?
Following this daily workflow using Empire Crypto dashboards helps you build institutional-level market awareness step by step.
Frequently Asked Questions (FAQ)
What is crypto data and how is it collected?
Crypto data includes on-chain records from blockchain ledgers (such as transaction counts, gas usage, and wallet transfers) combined with off-chain exchange data (such as order book depth and trading volume). It is gathered by running full blockchain nodes and aggregating market feeds through specialized platforms like Empire Crypto.
Why is Ethereum data especially important for crypto investors?
Ethereum is the primary settlement layer for decentralized finance (DeFi), stablecoins, real-world assets, and Layer 2 networks. Shifts in Ethereum network metrics usually lead broader market trends, making it a critical source of market intelligence.
How does on-chain analysis differ from traditional technical analysis?
Technical analysis focuses on historical price charts and volume patterns. On-chain analysis evaluates real-time blockchain activity—such as actual coin movements, active users, network usage, and validator behavior—showing the fundamental drivers behind price movements.
Can beginners use Empire Crypto data solutions effectively?
Yes! Empire Crypto is specifically designed to make complex blockchain data easy to understand for beginners, while offering the deep metric customizability required by professional traders.
Is on-chain data updated in real time?
Yes. On-chain metrics update with every new block produced on the Ethereum blockchain (roughly every 12 seconds). Platforms like Empire Crypto process and visualize these updates immediately.
What is the single most important metric for beginner Ethereum analysts?
While no single metric tells the whole story, Exchange Net Flows is one of the most straightforward and effective metrics for beginners. Tracking whether ETH is entering or leaving exchange wallets gives clear signals about potential market supply changes.
Conclusion: Take Control of Your Financial Future with Empire Crypto
The era of trading crypto based on social media hype, rumors, or basic chart patterns is ending. As institutional capital enters Web3, successful investors rely on transparent, real-time, on-chain intelligence.
By mastering Ethereum insights—such as tracking gas usage, monitoring whale movements, analyzing TVL, and evaluating MVRV ratios—you gain a clear, edge in navigating market cycles.
At Empire Crypto, our mission is to provide you with reliable tools, intuitive visualizations, and real-time alerts so you can navigate the market with confidence. Stop guessing where the market is going—start reading the blockchain data directly.
About The Author
